Case study
Service design
Digital Biodiversity Assessment Report
Connecting complex reporting journeys through a guided digital service.
In NSW, development or land clearing that could significantly affect threatened species or native vegetation must first be assessed by an accredited assessor. Their biodiversity assessment report records what’s on the land, what the proposal would impact and how that loss must be offset. That gives government a consistent, evidence-based foundation for its decision.
- My role
- UX/UI Designer
- Client
- NSW DCCEEW (Department of Climate Change, Energy, the Environment and Water)
- Completed at
- Folk
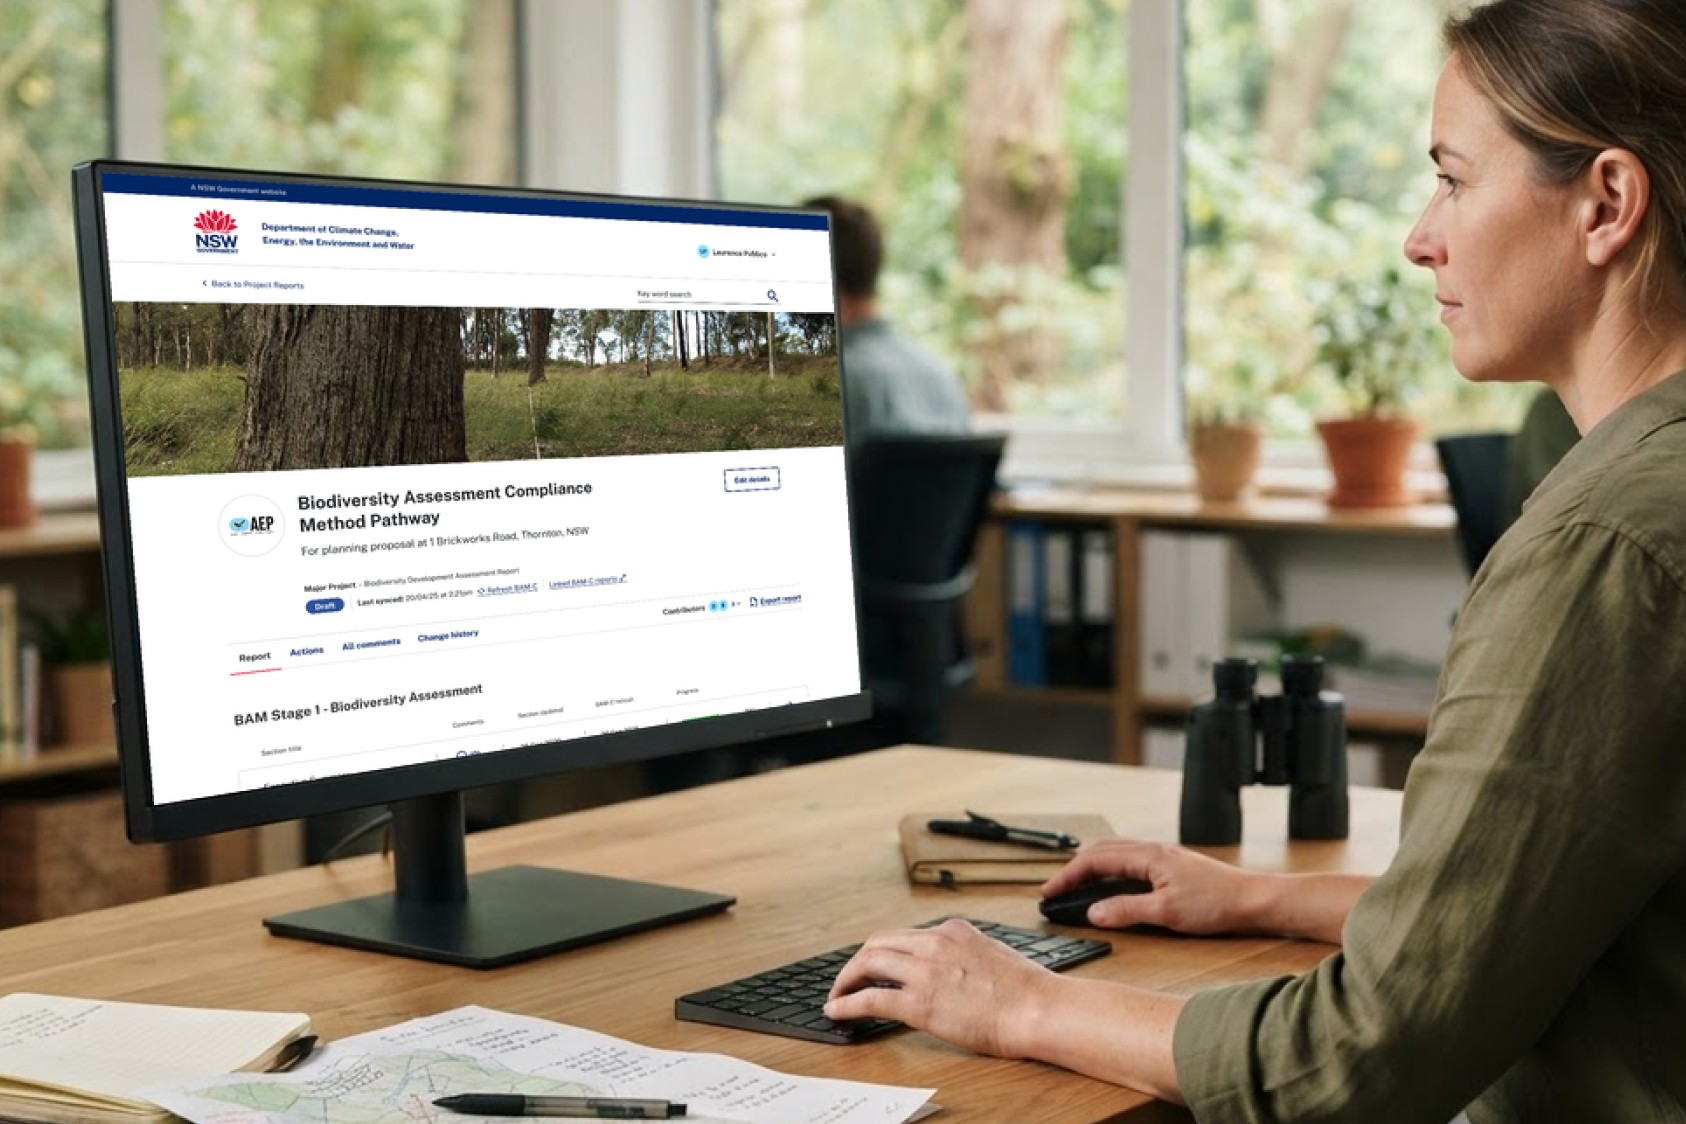
Context and challenge
The service covered three report types (BDAR, BCAR and BSSAR), each with its own assessor and reviewer workflows.
Assessors manually copied data from BAM-C into Word reports, cross-referencing line by line. Anything missed became a discrepancy in the final submission. Reviewers had to work through complex submissions, give specific feedback and work out what had changed when a report came back.
The challenge was to simplify both sides without compromising the regulatory process, within the technical constraints of the proposed service.
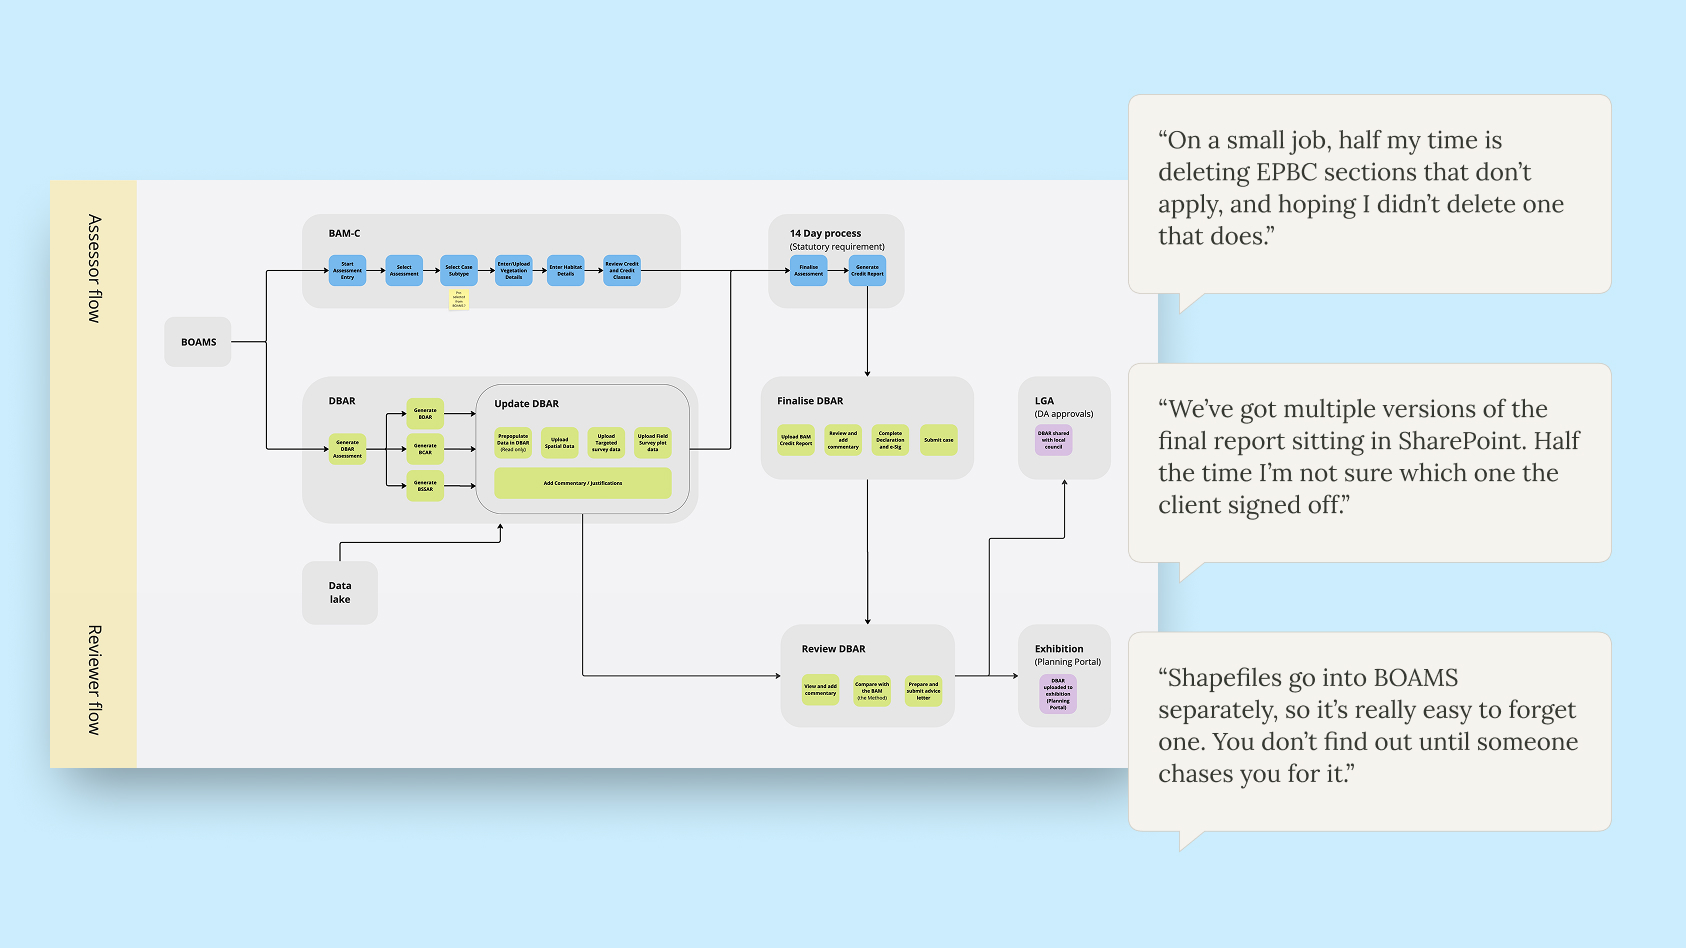
Mapping the service before designing it
Before exploring interface solutions, we needed a shared view of how reporting fitted into the wider project lifecycle. Building on existing research and client walkthroughs, I created the initial journey maps for all three report types, covering both assessor and reviewer workflows. Each map captured actions, touchpoints, actors, needs, pain points and opportunities, and I proposed the opportunity areas, which I then refined with the lead designer.
The maps turned a fragmented process into one coherent picture, showing where systems connected, where information changed hands and where friction built up. That gave us the foundation for the next stage: turning those challenges into opportunities to explore with stakeholders.
Turning opportunities into design concepts
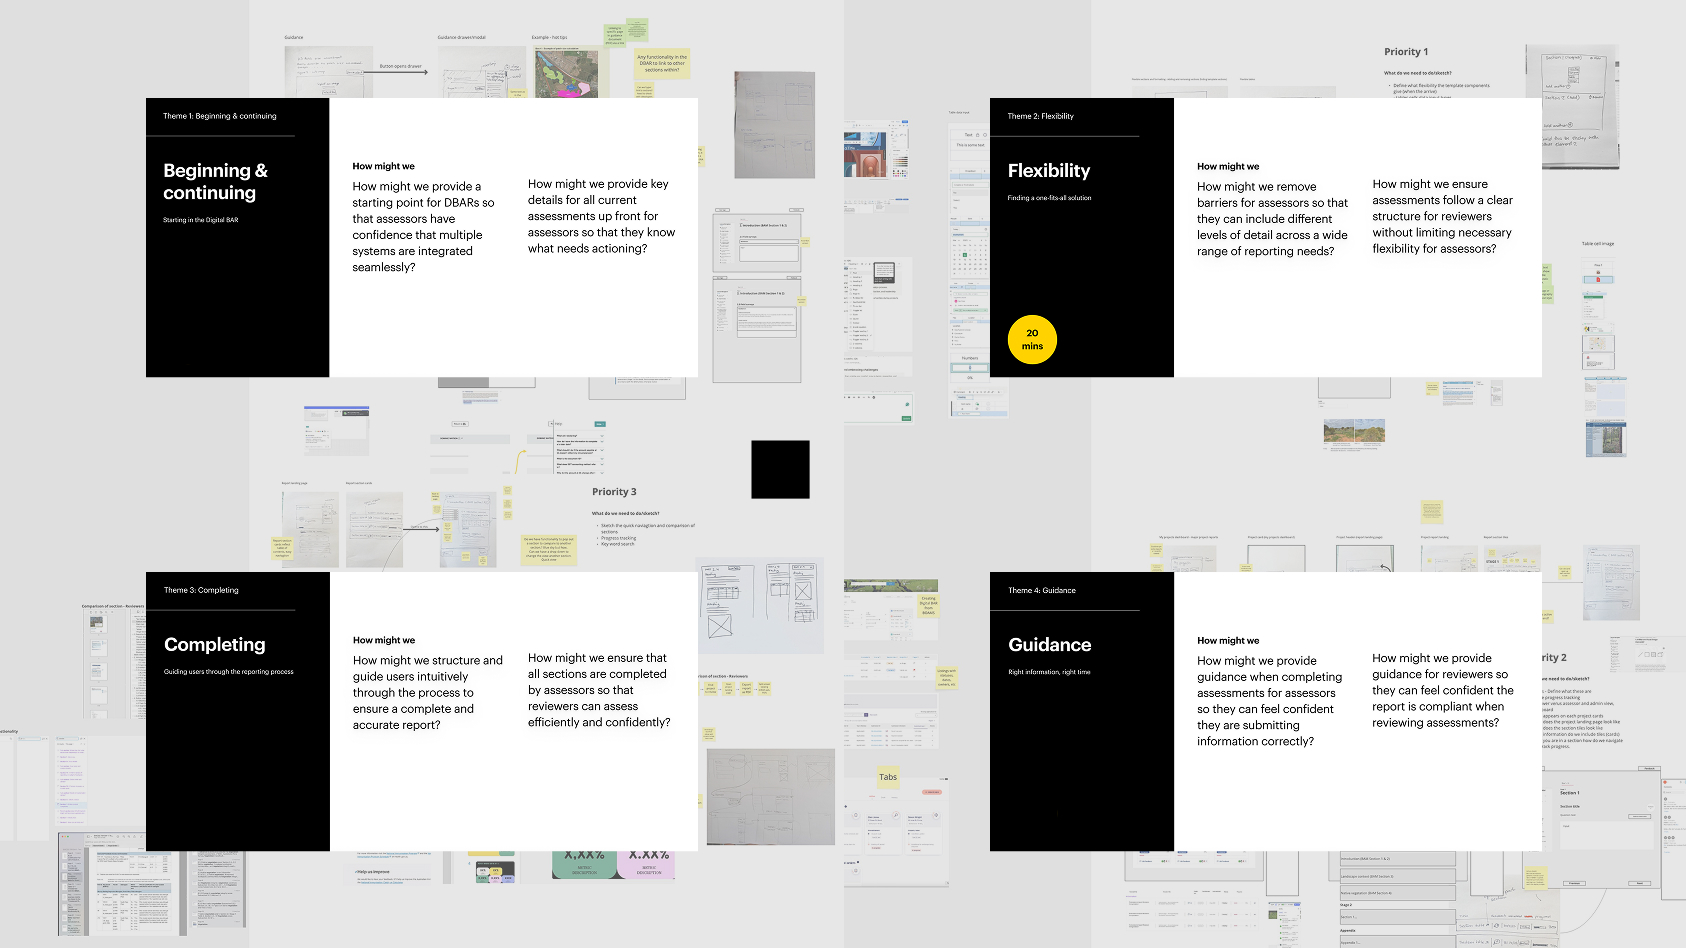
We brought the emerging opportunities into sketching and ideation workshops with relevant stakeholders and end users.
I prepared sketches and design references to make possible solutions tangible. Rather than asking stakeholders to imagine a future experience from abstract requirements alone, we gave them concepts they could respond to, critique and refine.
This helped clarify expectations and narrow the direction for further exploration.
With a clearer set of opportunities established, the team divided the proposed features and worked collaboratively on wireframes and prototype flows.
Designing interactions for complex reporting
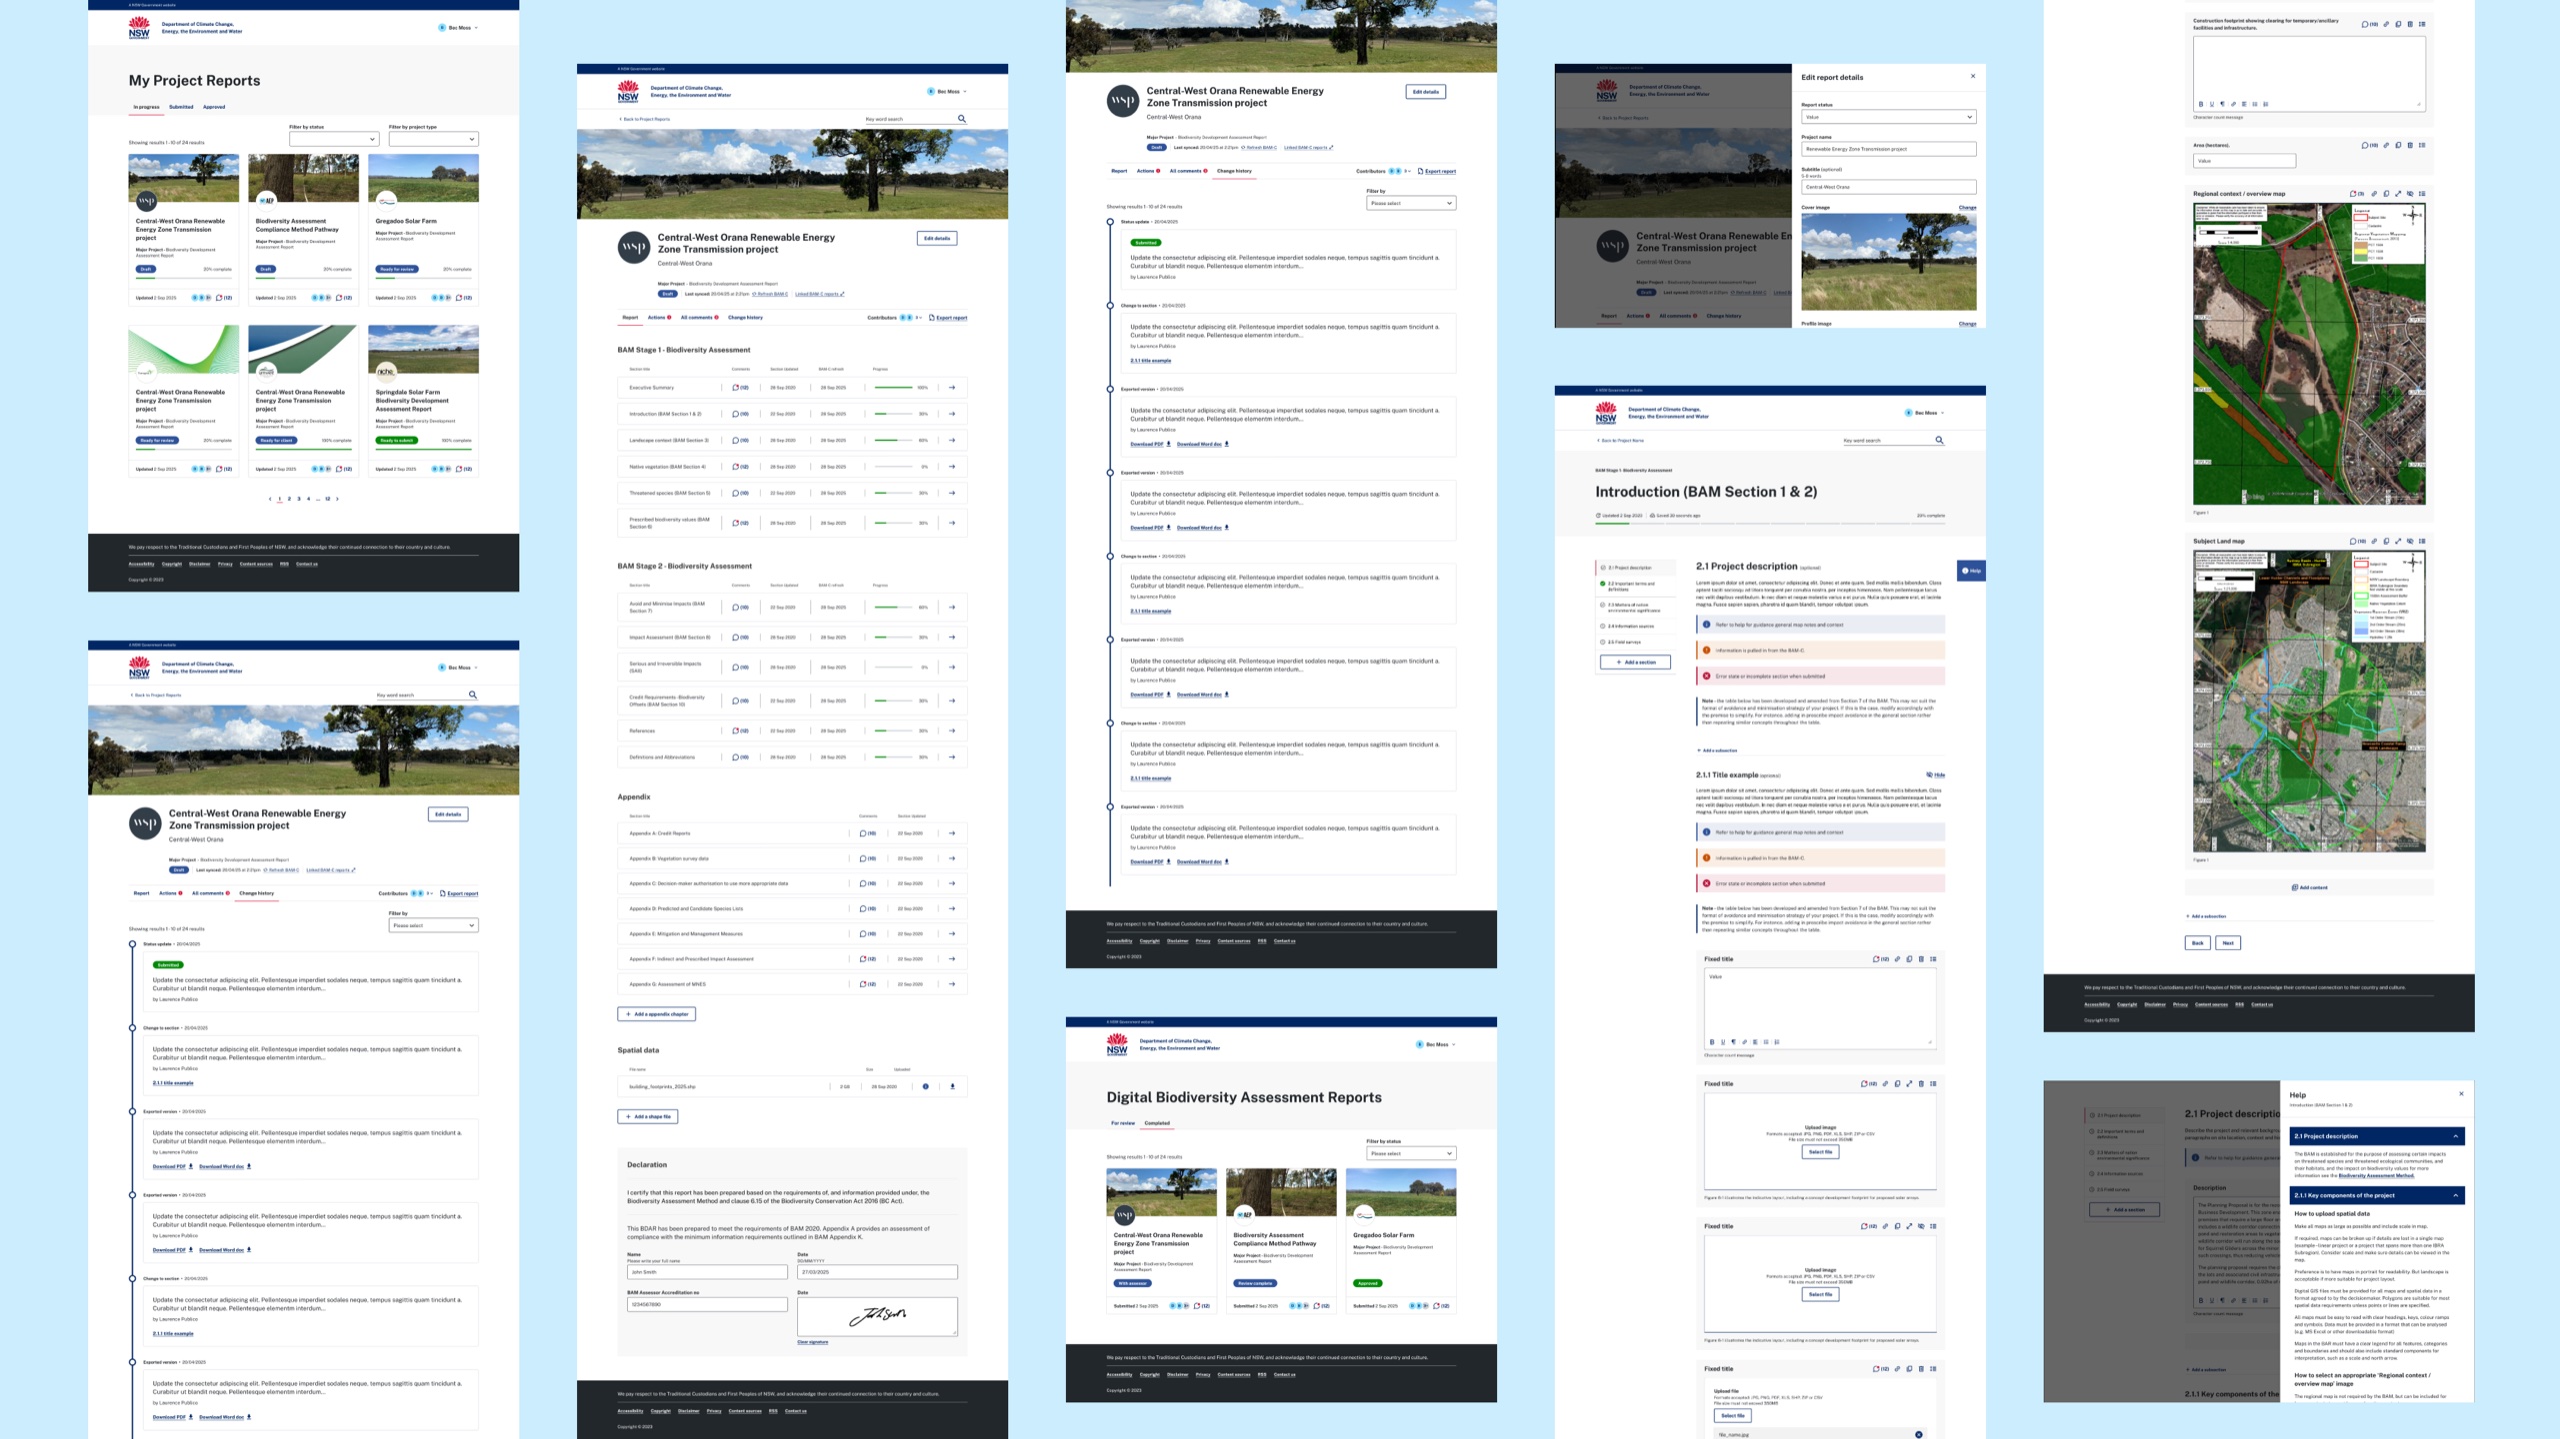
I contributed to designing selected features across the reporting and review experience. Amongst a long list of components I was tasked to design, these three areas illustrate the problems we were exploring and the design rationale behind them.
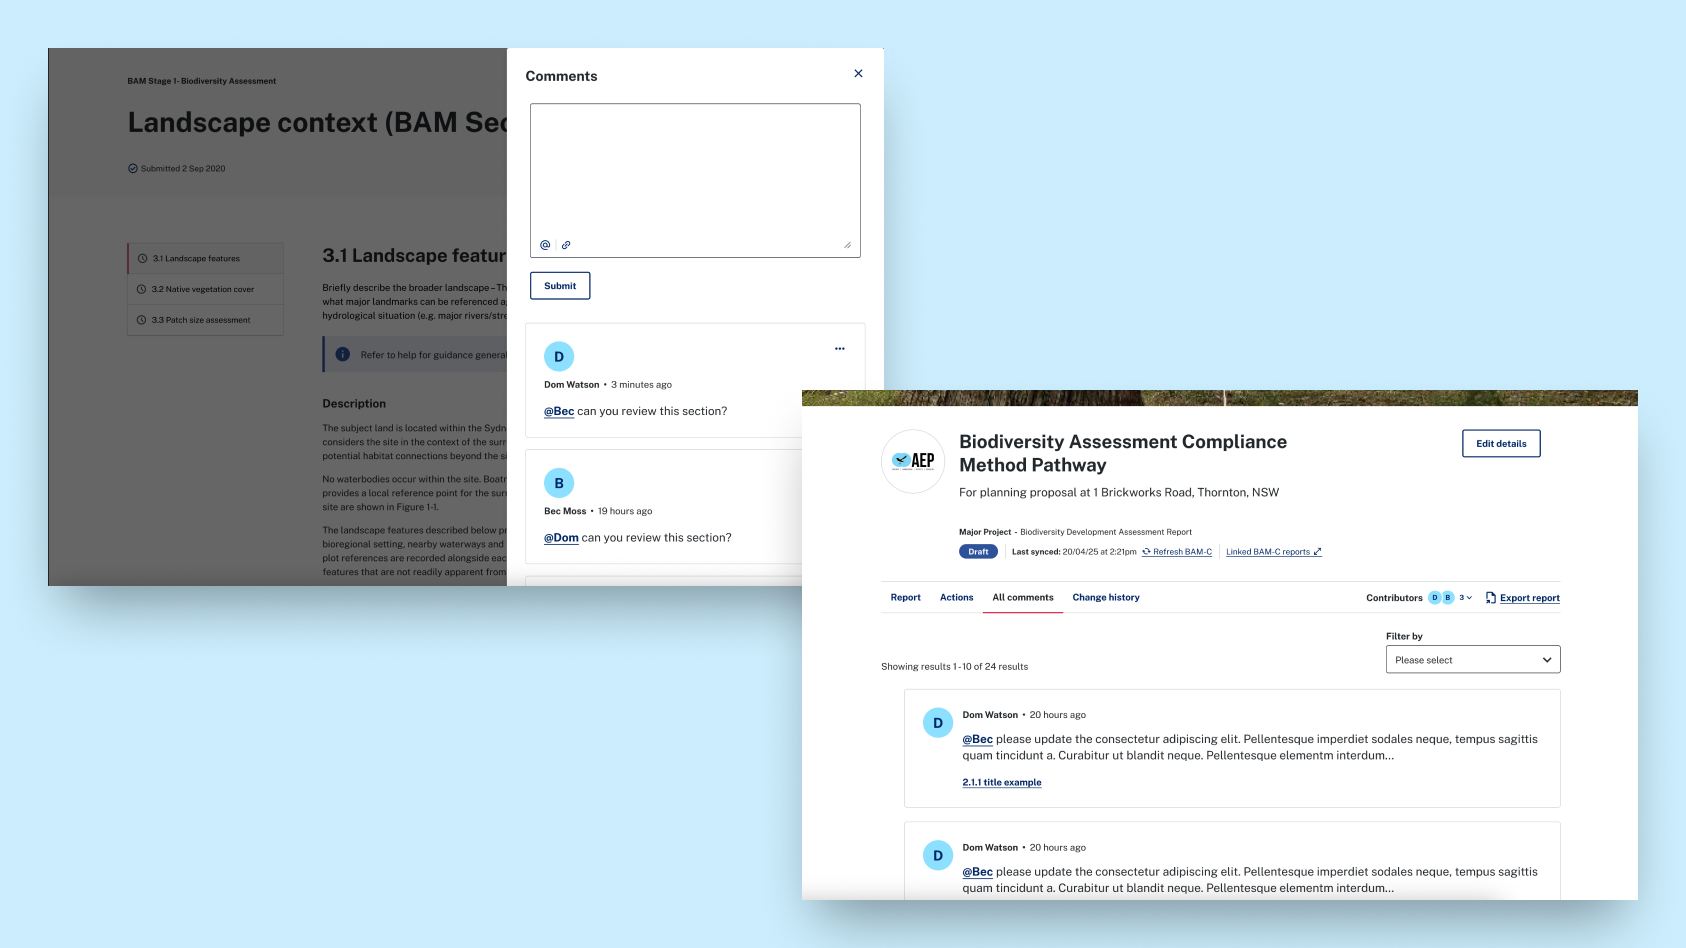
Making feedback more actionable
Reviewers could provide feedback through lengthy documents, making it difficult for assessors to identify exactly which part of a report a comment referred to.
I worked on commenting interactions that associated feedback with specific report sections. The intent was to give assessors clearer context when addressing review comments and make feedback easier to navigate during subsequent review cycles.
Clarifying data shared between systems
Digital BAR relied on information from BAM-C, which created challenges around duplicated data entry and keeping information aligned across systems.
I explored how the interface could represent multiple BAM-C reports, distinguish linked from unlinked reports, and clarify which information was populated automatically. I also worked with contextual callouts using NSW Government design-system patterns to explain where information came from and what users needed to provide themselves.
This aimed to make the relationship between the systems more transparent and reduce uncertainty when completing a report.
Balancing familiar editing with technical constraints
Assessors were accustomed to the flexibility of Word documents and wanted a similarly familiar editing experience. However, technical constraints limited how closely the digital service could reproduce that functionality.
I worked on interactions for adding and removing structured content blocks, including text, data inputs, images and files. This explored a more structured approach to report authoring while accommodating the different types of content the reports needed to support.
Alongside these explorations, I contributed to report-specific experiences, including reviewer dashboards, search and filtering interactions, project status indicators and the BSSAR reporting workflow.
Preparing the prototype for continued testing
The client wanted to keep testing the prototype with more stakeholders after our involvement ended. I wrote step-by-step guidance for 12 flows (seven assessor, five reviewer) across the three report types, covering tasks like starting and completing reports, managing contributors, commenting, formatting appendices and reviewing submissions. I also recorded a video walkthrough, so their team could run sessions confidently on their own.
Outcome and reflection
The project produced documented assessor and reviewer journeys, prototype concepts for selected reporting and review interactions, and step-by-step guidance to support further stakeholder testing.
The work was handed over as prototype concepts rather than a live product. Its outcome was a clearer documented direction for the future service and material the client could use to continue evaluating the concepts, rather than a measured improvement in review efficiency.
For me, the project reinforced the importance of understanding the relationships between people, processes and systems before designing individual screens. It also reminded me that good design extends beyond the interface itself; documenting the experience clearly can help others continue the work beyond the immediate project team.